> For the complete documentation index, see [llms.txt](https://docs.natoma.ai/llms.txt). Markdown versions of documentation pages are available by appending `.md` to page URLs; this page is available as [Markdown](https://docs.natoma.ai/docs/enterprise/monitor.md).
# Monitor AI
Understanding which actions have been taken by AI and who prompted those actions is a black box. Natoma logs all activity taken by AI including key details like the initiating user or agent, LLM, tool called and more.
To see more details about activity taken by AI in your organization, navigate to the **Activity** page, which contains two tabs:
#### Dashboard
Gain a high-level understanding of what apps have been installed in your org, what tool calls are being made, and what AI access was discovered outside of Natoma.
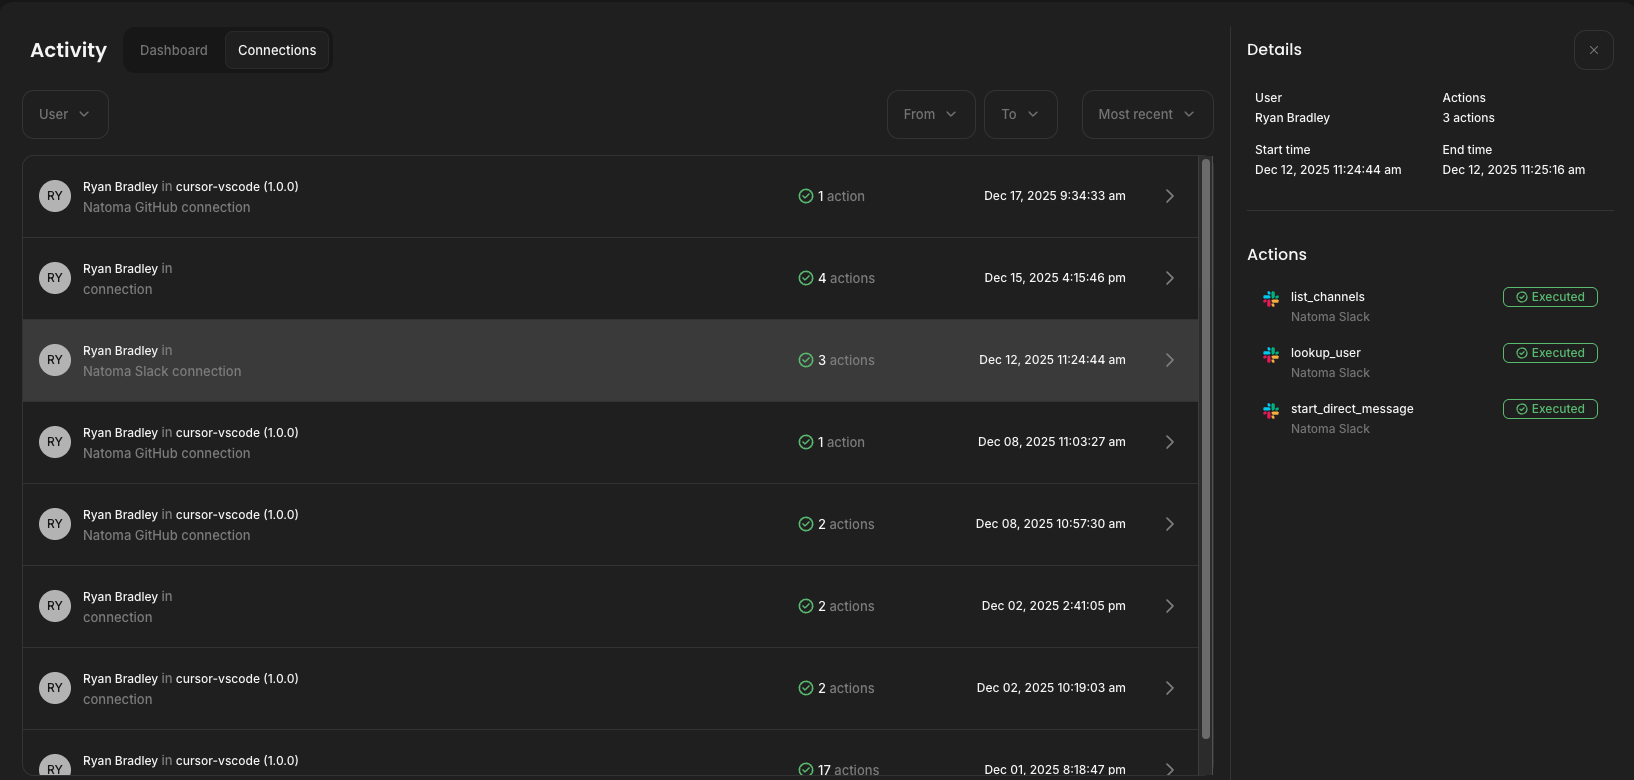
#### Connections
A detailed log of every tool call made through Natoma, including the app used, tool called (and arguments included), and the result (e.g. success, policy violation). Tool calls associated wtih the same prompt will be grouped together in the logs, as shown in the screenshot below.